Electric Load Prediction

A competition for accurate prediction of produced electrical power and required load for determining the residual power demand.


Sector
Electricity/Energy
Topic
Time Series Prediction
Tools
Tensorflow
Project duration
2-4 weeks

At a Glance

As part of a competition organized by Städtische Werke AG in Kassel, the House of Energy e.V. and the hessian.ai, Qnovi GmbH has developed an efficient and precise system for forecasting the residual electricity demand of a municipal maintenance facility for the next day.

This required both a model to predict the electrical power produced by the facility's own photovoltaic system, as well as for the consumption within the facility. Whereas the solar power generated is primarily influenced by the weather, consumption forecasts are dominated by operational processes and human factors. For example, the system is able to correctly map the effects of bridge days or strike announcements on the electrical power required in the facility.

From the model predictions, it is possible to derive how much residual energy the energy supply company (EVU) must provide to the customer in the next 24 hours distributed over 15-minute intervals. This forecast can be used by the power supply company to make more targeted purchases on the EPEX day-ahead market.

On 15.12.2022 the hessian.AI, Städtische Werke AG Kassel and the House of Energy e.V. launched a competition on Kaggle. Here, data of a solar installation and an industrial facility were made available. The goal was to predict the residual load, which can be calculated with the help of the produced photovoltaic power and the electrical consumption within the facility.
In total 22 teams participated in this competition and Qnovi GmbH reached 🥉 place.

In a first step, we examined the data more closely and eliminated potential sources of problems. 
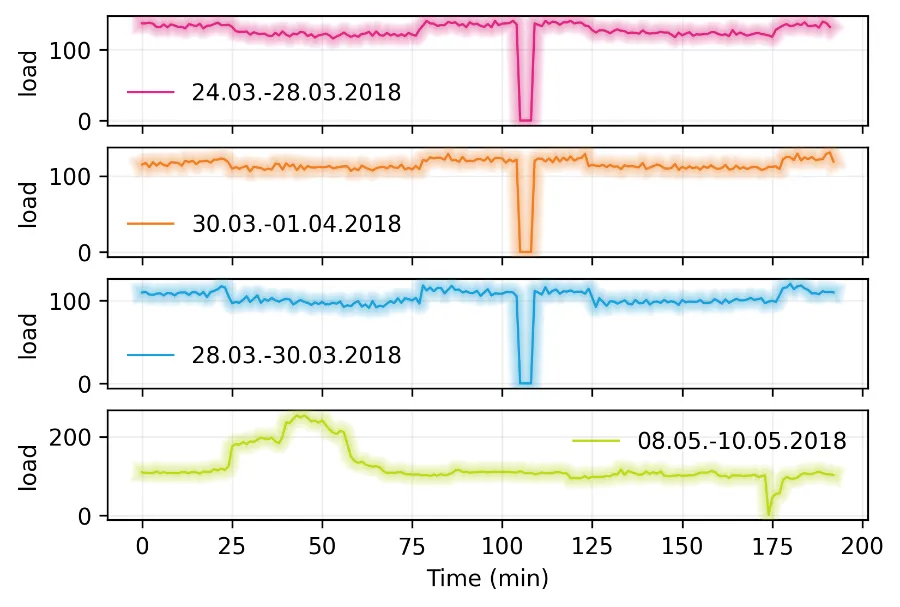
These included various measurement errors where no load was measured or double values at the time changeover. In addition, we gained a better understanding of the data and analyzed possible influencing quantities.
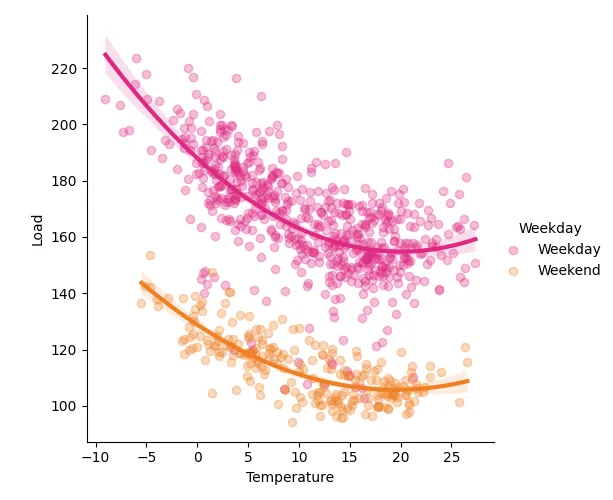
For example, load was highly dependent on the day of the week (weekday vs. weekend), seasonality, and ambient temperature. Some of the solar system data was relatively scattered and in some areas there were outliers where the radiation did not correlate with the power produced. Nevertheless, the generated power was dependent on sun radiation, ambient temperature but also on different weather events.

Once we had analyzed the various influencing variables, we had to make them available to the algorithm. For this purpose, we had extended the already existing data by further features. 
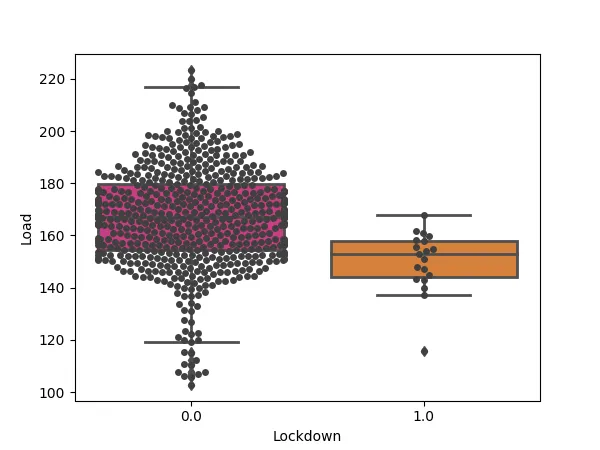
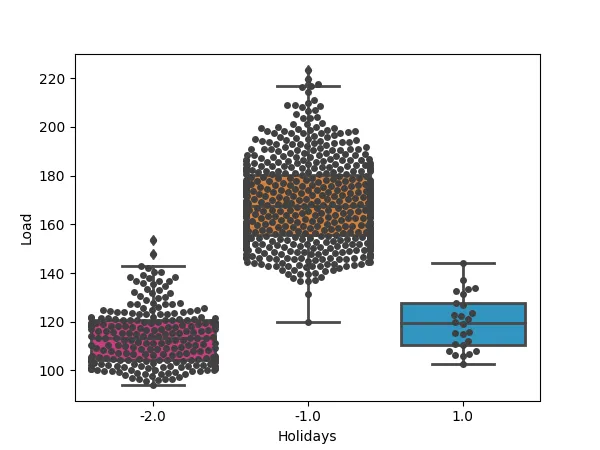
For example, the day of the week, the month, the year, or more complex contexts such as holidays or strikes were used for load forecasting.
Additional weather data from the German Meteorological Service (DWD) was used to forecast photovoltaic output. It was also investigated whether other weather radar data could be used. However, due to the unknown location of the installation, this could not be pursued further during the competition.

The next step was to prepare the data so that it could be used for training. On one hand, the data had to be split so that the prediction accuracy could be compared with an independent data set.
In addition, the data had to be divided into day-by-day blocks. This ensured that the algorithm could also learn a time context.

The training of the AI algorithm was done using the Tensorflow library and took between 8-12 minutes depending on the settings. These short training durations result from the relatively small amount of data compared to other projects. Since the competition was to achieve the best possible prediction accuracy, an automated optimization of the algorithm's hyperparameters was performed using Ray Tune.
To keep track of the different networks, the ML-Flow library was used. This allowed different configurations to be traced and the best settings to be determined.

In order to ensure a reliable and accurate prediction, the algorithms were examined in more detail. For this purpose, the accuracy was calculated on the basis of a validation data set, and the influence of the different input variables was investigated. In addition, the prediction in the time boundary areas was also tested, among other things.

The implementation of the algorithm was not part of the challenge. In general, the algorithms can be connected to existing systems in various ways. Thus, these can be executed on the cell phone (iOS/Android) and a microcontroller or even in the browser as well as on the PC. For this purpose, a wide variety of interfaces are available via C, C++, Python, Swift, Java and Javascript.
Summary of the Working Process

Icons created by Freepik , Smashicons, Eucalyp - Flaticon

Background

Qnovi Example

An important part of the energy transition is the expansion of decentralized renewable energy sources. A large area of use in this context are systems for generating in-house electricity via photovoltaic modules on industrial and commercial properties. The electricity generated is primarily consumed by the customers themselves. Additional capacities are purchased if the required quantities are not sufficient., If too much electricity is generated, it is fed into the power grid and sold. The resulting residual load (residual load = energy demand - self-generated energy) must be provided by the energy supplier.
To ensure a stable energy supply, energy providers rely on forecasts of residual loads. In the past, these residual loads could be forecast based on many years of experience and statistics. Now, the amount of solar installations, and thus the amount of self-generated electricity, continues to increase. This makes forecasting residual loads more and more complex, as there are additional dependencies on external factors such as weather. However, forecasting the residual power demand is necessary to maintain a safe and proper power supply operation.

Our Procedure

Data Analysis - Load

Qnovi Example

First, an intensive data investigation and preparation was carried out. Among other things, two issues were noticed with the load. During the time changeover, there were duplicate and inconsistent data lines, and at the same time the load value was 0. In addition, there also seems to have been a load drop on 09.05.2020 at 19:30.
Since there usually was a base load and loads of 0 kW differ significantly from this base load, these values were marked as outliers, removed and the adjacent values were interpolated. Otherwise, there could have been a strong influence on the later forecasts.

In order to investigate in more detail which input data are useful at all for later modeling, further analyses were performed. In general, the electric load is strongly dependent on seasonality. For example, electricity consumption in winter differs significantly from that in summer. Thus, the seasonal differences of spring, summer, fall and winter must be represented by the model. This is done by categorizing the respective year into different sections.
Since this is not the general load, but the load of a specific company, other factors play a role. These include, for example, the start of work, break times, different vacation periods or the general capacity utilization of the facility.
Similarly, there are also strong differences between the weekend and the working week. During the working week, both the base load and the peak load of operations are significantly higher. Public holidays and strikes have a similar influence.

Data Analysis - Solar Power

In principle, it would have been possible to estimate the power produced by the photovoltaic system by means of physical modeling based on the radiation data and the efficiency. However, it turned out that this would have required compensation for the temperature effect on the efficiency. This can be seen well in the relatively wide band of produced power
In addition, there are partial sections where the produced power did not correlate with the incoming radiation. The drop in the radiation signal seems to precede or follow in these areas, but no reason for this can be determined from the data. Thus, local effects could also play a role, for example partial covering of the photovoltaic modules by shadows.

Feature Engineering

In order to be able to use the investigations described above also for the later training of the neural networks or generally of the machine learning algorithms, the appropriate features had to be generated. Public holidays are listed in the Python library holidays. Furthermore, additional, non-statutory holidays such as Christmas Eve or New Year's Eve were entered.

Further investigations showed that several strikes took place during the periods. Since strikes - especially in the public sector - are usually announced, this feature can also be used during the later application of the algorithm.
Furthermore, input features had to be created so that the algorithm learns the seasonality and does not just overfit to the date. For this purpose, additional columns were created for the week, the month and the year..

Basically, no further features are needed for the power prediction of the photovoltaic system. Both the direct and indirect radiation as well as other data such as the ambient temperature should be sufficient for the modeling. However, it became apparent during the data analysis that the variance was relatively high in some cases and several outliers were present. On the one hand, this can be attributed to the influence of the temperature and the dirt level on the efficiency of the solar cells, but also to local effects such as the partial covering of the solar cells by clouds or snow.

Data Splitting and Slicing

The data provided consists of two csv files, the training and test data. In total, these cover a period of approximately 3 years between January 2018 and October 2020. From this total period, contiguous periods of varying length are present within the training data. This is followed by a period of about one week with test data, which was used for monitoring the prediction accuracy. In between, a short period is missing to prevent simple interpolation
Since neural network training usually requires a validation dataset, this had to be created first. The last week of the training data set was used for this purpose, as it is relatively similar to the subsequent test data. With the help of the validation data set, a possible overfitting can be identified and it is used to gradually reduce the learning rate during the training.

The neural network for predicting the power consumption within the company was trained exclusively with data supplied on a daily basis. The neural network for the prediction of the produced electrical power was trained both on a daily basis and on a tabular basis or directly on the basis of the transmitted data.
Thus, for the training, daily blocks were generated in another preprocessing step.

Data-Windowing

Neural Network Training

As in many other customer projects, we used the Python library Tensorflow for neural network training. For this, we had decided to use an LSTM for load prediction due to the strong time dependency. For the prediction of the photovoltaic power, a hybrid approach was chosen. Due to the physical correlations in the input data, there should be no time dependence there. Nevertheless, a better prediction accuracy was partially shown with LSTM cells, which was due to the problems described above, where the incoming radiation did not correlate with the produced electrical energy. Such local effects can be partially covered by LSTM cells.

illustration ensemble learning

To further increase the prediction accuracy, a so-called ensemble learning was used. Here, predictions from different models are used and averaged. The benefit is that a better prediction accuracy can be achieved.

Validation

Due to the relatively limited data set, the internal evaluation of the algorithm was performed using the validation data set. For this purpose, both the RMSE, which was also used for the final evaluation, and other evaluation parameters such as the MSE or MAE were calculated.
The final evaluation in the competition was done via the Kaggle platform using input data whose associated load and performance were not known to the competition participants or to us.

Implementation

  • Python
  • C++
  • C
  • Swift
  • Android (Java)
  • Javascript
  • ...

The implementation of neural networks or models was not part of the challenge, nevertheless some possibilities are shown below.
Since the Tensorflow library was used for training the networks, all available interfaces of this framework can be used.
Thus, a direct execution on the control unit, microcontroller or cell phone with iOS or Android can be realized. In addition, it can also be used directly in the browser via Javascript or alternatively via an API with an active Internet connection.